最大最小聚类
机器学习
我写的最大最小聚类.但是我写的时候只写了依据最小进行聚类 233
算法流程
- 随机找一个点为第一个聚类中心
- 找距离这个点最远的点为第二个聚类中心
- 遍历所有的欧式距离,以其中较小的距离为准,如果这个距离大于第一第二聚类点的\(\theta\)倍,那么这个点就是新的聚类点.重复直到没有新的聚类点.
- 分类即可
代码
import math
import matplotlib.pyplot as plt
import numpy as np
def createDataSet():
"""
创建测试的数据集,里面的数值中具有连续值
:return:
"""
dataSet = [
[0.697, 0.460], [0.774, 0.376], [0.634, 0.264],
[0.608, 0.318], [0.556, 0.215],
[0.403, 0.237], [0.481, 0.149], [0.437, 0.211],
[0.666, 0.091], [0.243, 0.267],
[0.245, 0.057], [0.343, 0.099], [0.639, 0.161],
[0.657, 0.198], [0.360, 0.370],
[0.593, 0.042], [0.719, 0.103], [0.359, 0.188],
[0.339, 0.241], [0.282, 0.257],
[0.748, 0.232], [0.714, 0.346], [0.483, 0.312],
[0.478, 0.437], [0.525, 0.369],
[0.751, 0.489], [0.532, 0.472], [0.473, 0.376],
[0.725, 0.445], [0.446, 0.459],
]
# 特征值列表
labels = ['密度', '含糖率']
# 特征对应的所有可能的情况
labels_full = {}
for i in range(len(labels)):
labelList = [example[i] for example in dataSet]
uniqueLabel = set(labelList)
labels_full[labels[i]] = uniqueLabel
return dataSet, labels, labels_full
# 计算两点之间的欧式距离
def one_one_dict(a: list, b: list)->float:
return pow(a[0]-b[0], 2)+pow(a[1]-b[1], 2)
# 计算一个点与所有聚类中心的欧式距离
def one_n_dict(sample, centers: list)->np.ndarray:
sample = np.array(sample)
centers = np.array(centers)
# 将sample复制k次 与 centers 矩阵维度相同
samples = np.tile(sample, (centers.shape[0], 1))
# print(samples)
# 矩阵相减然后平方,对每一列求和 distances=[1 x k]
distances = np.power(samples - centers, 2).sum(axis=1)
return distances
# 计算n个点到一个中心点的欧式距离
def n_one_dist(X, c):
c = np.array(c, ndmin=2)
c_s = np.tile(c, (X.shape[0], 1))
# 利用矩阵乘法求出欧式距离矩阵
distances = np.power(X-c_s, 2).sum(axis=1)
return distances
class Maxmin(object):
def __init__(self, x, theta):
self.x = x
self.centers = [] # 聚类中心矩阵
self.theta = theta # 生成新聚类中心可能性
# 确定第一个聚类中心
def init_center(self, cent=None):
"""
cent=None 时 随机生成初始聚类中心 否则指定点
"""
if cent == None:
cent_index = np.random.choice(np.shape(self.x)[0])
else:
cent_index = cent
self.centers.append(self.x[cent_index])
# 确定第二个聚类中心
def second_center(self):
dists = n_one_dist(self.x, self.centers[0])
cent_index = np.argmax(dists)
self.centers.append(self.x[cent_index])
# 计算各个样本与中心点的距离,返回距离矩阵
def calc_dist(self)->np.ndarray:
dists = np.zeros((self.x.shape[0], len(self.centers)))
for i in range(self.x.shape[0]):
dist = one_n_dict(self.x[i], self.centers)
# 选距离中心点小的距离作为结果
dists[i] = dist
return dists
# 生成新的聚类中心,返回是否成功生成
def new_center(self, dists: np.ndarray)->bool:
# 按列取最小值
dists = np.min(dists, axis=1)
# 最大距离大于两个中心点之间的距离就生成新中心点
# 这里加pow是因为我前面算距离都没有开平方
if pow(max(dists), 0.5) >\
self.theta*pow(one_one_dict(self.centers[0], self.centers[1]), 0.5):
self.centers.append(self.x[np.argmax(dists)])
return True
else:
return False
# 当没有新的聚类中心之后,生成对应类别
def make_ylabel(self, dists: np.ndarray)->list:
index = np.argmin(dists, axis=1)
return index
def fit(self, cent=None):
"""
cent=None 时 随机生成初始聚类中心 否则指定点
"""
# 得到第一个聚类中心
self.init_center(cent)
# 得到第二个聚类中心
self.second_center()
# 迭代计算新的聚类中心
distances = self.calc_dist()
while self.new_center(distances) == True:
distances = self.calc_dist()
# 根据距离获得label
return self.make_ylabel(distances)
if __name__ == "__main__":
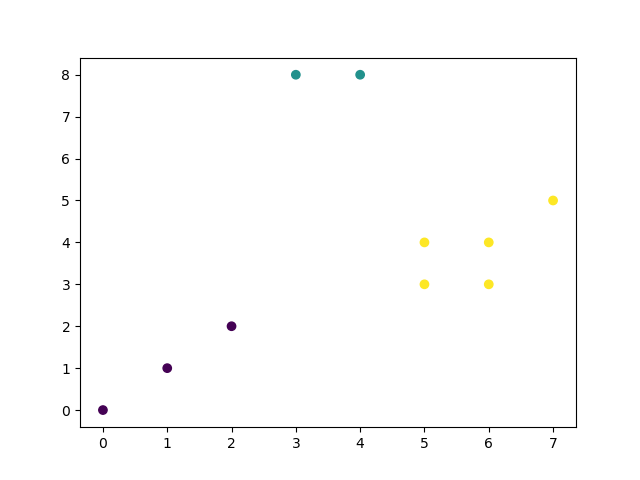
# 书上的例子
data = [[0, 0], [3, 8], [2, 2], [1, 1], [5, 3],
[4, 8], [6, 3], [5, 4], [6, 4], [7, 5]]
data = np.array(data)
mm = Maxmin(data, 0.5)
y = mm.fit()
plt.scatter(x=data[:, 0], y=data[:, 1], c=y)
plt.show()
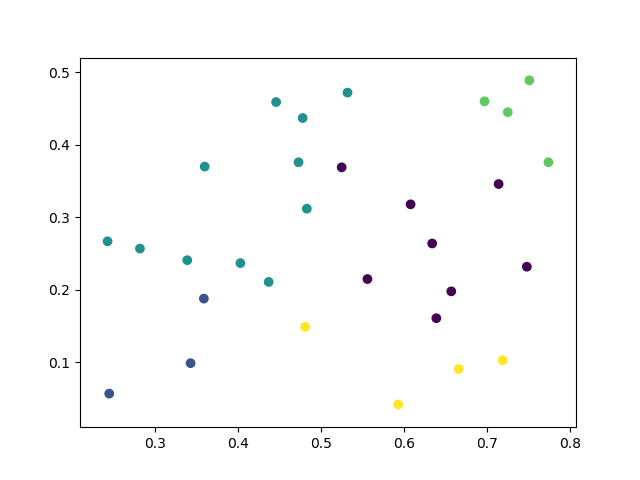
# 西瓜书中的数据
data, _, _ = createDataSet()
data = np.array(data)
mm1 = Maxmin(data, 0.5)
y = mm1.fit()
plt.scatter(x=data[:, 0], y=data[:, 1], c=y)
plt.show()效果